-
Why Would Anyone Buy a Chetak? A Layer-by-Layer Audience Breakdown

Suppose, I have a brand and I want to sell my products or services, for this I want to find potential customer who will buy my product, so I will think of how my potential buyers might look like, I will identify what gender will be interested in my product, where he or she lives,…
-
How to Analyse GA4 Acquisition
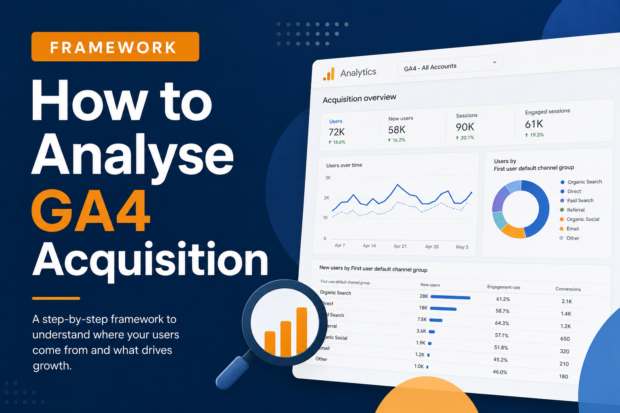
The first stage in the Funnel of any business is Acquisition, how the business is acquiring customers – an important one to identify the role of the business position. Let’s analyse how to analyse the acquisition of any business’s GA4 account. Firstly analyse the current state of the acquisition, which channels are contributing to the…
-
How to Actually Interpret GA4 User Metrics
Users – Who They Are and Why They Matter GA4 offers a wide range of metrics, but today I’ll focus on the foundational metrics, along with the examples and interpretations — Users. GA4 Users Categorized Simple Explanations Active Users Users who had at least 1 engaged session within a specific time period are counted as…