
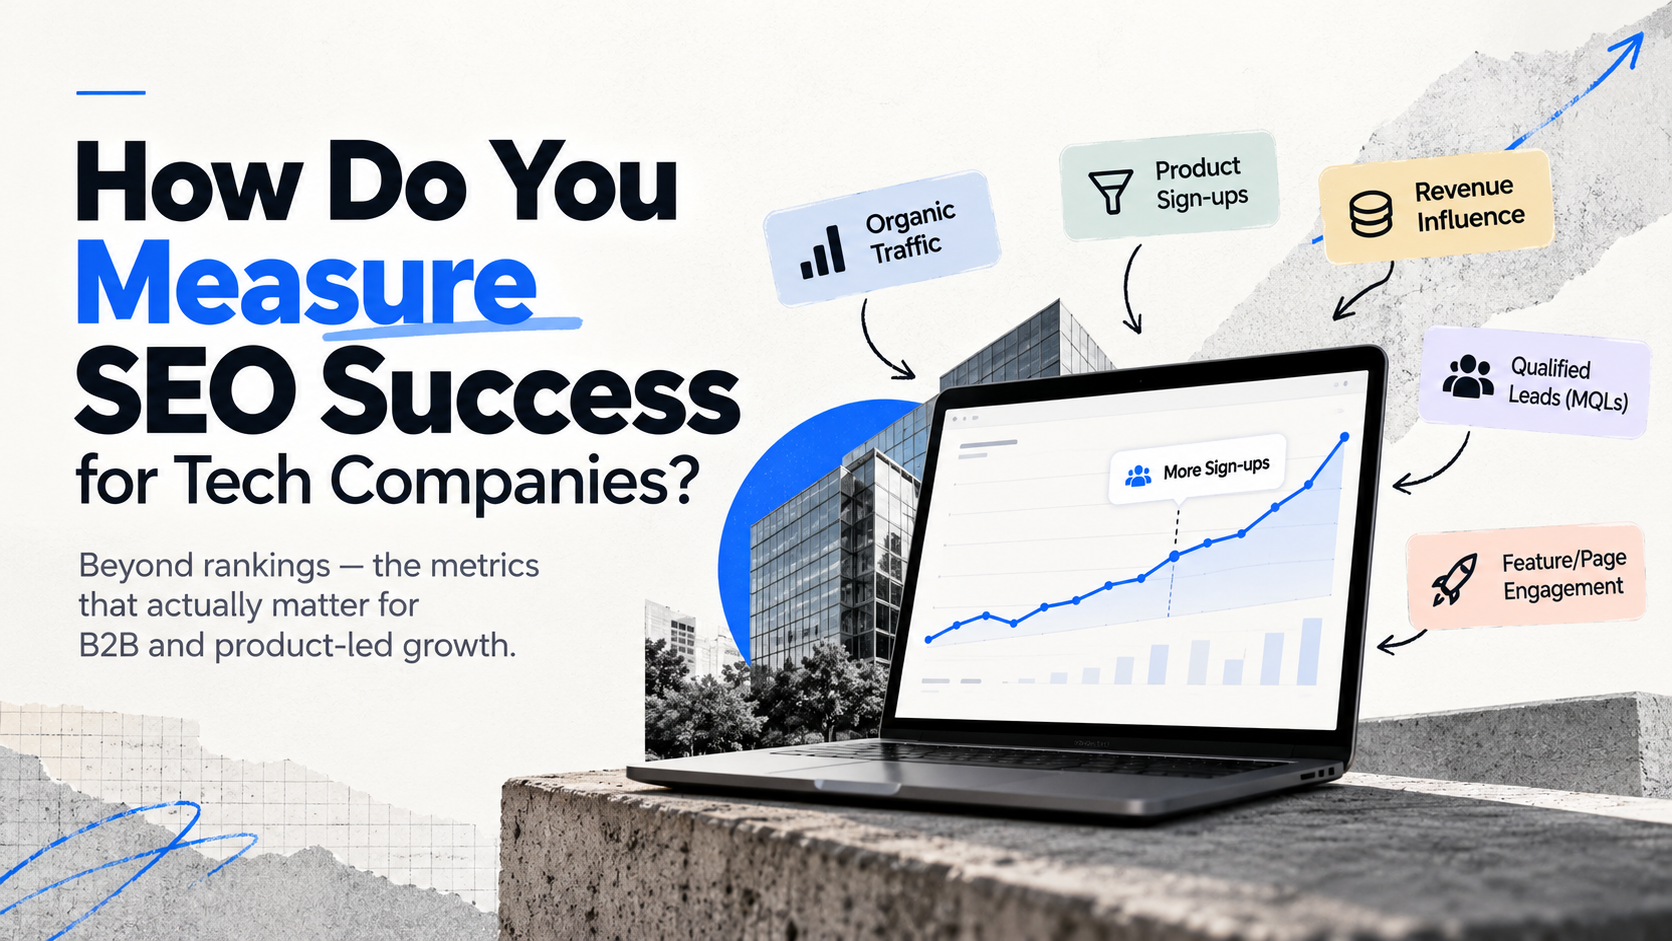
How Do You Measure SEO Success for Tech Companies?
Short answer: measure SEO by what it contributes to pipeline and revenue, not by traffic or rankings. For a tech or SaaS company, that means tracking four layers together: non-branded visibility by buyer intent, conversion quality, sourced and influenced pipeline, and visibility inside AI-generated answers. Traffic and rankings still matter, but only as inputs to those four.
This framework is written for B2B software and SaaS companies. Hardware and consumer-tech brands share some of it, but their funnels differ.
Why the Standard SEO KPIs Mislead Tech Companies
Tech companies have an unusual funnel: small audiences, high contract values, long sales cycles, and several people involved in every purchase. That breaks the usual scoreboard in three ways.
Traffic overstates progress. Most B2B SaaS sites convert somewhere between 1.1% and 2.5% of visitors into leads, depending on the dataset (SerpSculpt, citing First Page Sage; Adv.me). One benchmark compilation puts the median visitor-to-customer rate at roughly 0.10% (Adv.me). At that rate, 10,000 visits produce about ten customers, and a traffic spike from informational content that never touches a buying decision produces almost none.
Rankings depend on which keyword you rank for. Position one for a definition query and position eight for “[category] software alternatives” are not comparable wins. A single blended average hides the difference.
Branded growth hides weak demand creation. Branded searches come from people who already know you. Blending them into one organic line lets a strong brand mask a program that isn’t reaching anyone new.
The Four-Layer Measurement Stack
| Layer | What to track | Where to find it |
|---|---|---|
| 1. Non-branded visibility by intent | Clicks, impressions, average position, and distinct query count per intent tier | Search Console |
| 2. Conversion quality | Visitor-to-lead rate and MQL-to-SQL rate for organic, by landing page type | GA4 plus CRM |
| 3. Pipeline and revenue | Organic-sourced and organic-influenced pipeline, closed-won ARR, payback period | CRM |
| 4. AI-answer visibility | Share of model and citation share on category prompts; AI referral traffic | Manual prompt audits, GA4 |
Layer 1: Non-Branded Visibility, Split by Intent
Start by removing your brand from the picture. In Search Console, add a Query filter set to “Doesn’t match regex” and enter your brand name, product names, and common misspellings separated by pipes (for example, yourbrand|your brand|yourbrnd). Search Console uses RE2 regex syntax, so test the pattern on your own property before trusting it.
Then group the remaining queries into three tiers, because each answers a different business question:
- Problem-aware queries (“how to reduce churn”): reach and topical authority. Slow to convert, and the most competitive.
- Solution-aware queries (“best churn analytics software”): the shortlist stage, where buyers compare categories.
- Vendor-aware queries (“[competitor] alternatives,” “[your category] pricing,” “[tool] vs [tool]”): closest to a purchase, with the lowest volume and the highest value per click.
Track distinct query count alongside clicks. It often rises months before clicks do, which makes it the best early read on whether new content is being matched to real searches.
Layer 2: Conversion Quality, Not Conversion Volume
Mark the events that signal real intent as key events in GA4: demo request, trial start, and contact-sales click. Report them by landing page type (blog, comparison page, pricing, integration page), because organic leads from a comparison page and from a top-of-funnel guide are different animals.
Benchmarks help here, with a caveat. Compilations built on vendor client data put organic search at around 2.1% visitor-to-lead against 0.7-1.0% for paid search, and show organic leads moving from marketing-qualified to sales-qualified at around 51% against roughly 26% for paid (ConversionXperts). Many articles repeat the same underlying figures, so treat them as one data source, not several. Product-led companies convert far higher at the top of the funnel (3-9%) than sales-led ones (0.5-1.5%) (CausalFunnel), so compare yourself to your own go-to-market model.
Illustrative arithmetic, not a forecast: at those rates, 10,000 non-branded visits yield about 210 leads, around 86 marketing-qualified leads, and roughly 44 sales-qualified leads. The same 10,000 visits from purely informational queries, converting at a fraction of that rate, produce a fraction of the pipeline. Intent mix, not traffic volume, drives the result.
Layer 3: Pipeline and Revenue, Measured Honestly
This is where tech SEO measurement usually breaks. The median B2B sales cycle runs about 84 days, and far longer for enterprise deals (Prospeo) — well beyond the cookie and lookback windows most analytics setups rely on. The click that started the journey is often invisible by the time the deal closes.
Three practices fix most of the damage:
- Pass first-touch data into the CRM. Capture landing page, source, and medium in hidden form fields so every lead record carries its original entry point.
- Report sourced and influenced pipeline separately. Sourced means organic was the first touch. Influenced means organic appeared anywhere in the journey. Last-click reporting in common CRMs credits branded search or direct visits for deals that earlier content actually opened (SaaS Hero).
- Add a self-reported attribution field. An open-text “How did you hear about us?” on demo and trial forms surfaces channels that clicks never record, such as podcasts, peer recommendations, and AI assistants (Reditus). One vendor analysis suggests 30-50% of pipeline originates in channels digital attribution can’t see (Geisheker). Treat that as an order of magnitude, not a benchmark.
Then triangulate. If branded search impressions, direct traffic, and self-reported “found you through Google” answers all rise in the same window as your non-branded content, the case for SEO-driven demand is much stronger than any single number makes it.
Layer 4: Visibility Inside AI Answers
For software, this layer is no longer optional. G2’s 2026 Buyer Behavior Report, a March 2026 survey of 1,076 B2B software buyers, found 51% now start research with an AI chatbot more often than with Google, up from 29% in April 2025. It also found that 69% chose a different vendor than originally planned based on chatbot guidance, and that 33% bought from a vendor they had never heard of before the chatbot named it (G2; Demand Gen Report). Separately, TrustRadius data reported by Demand Gen Report found 83% of buyers shortlist three or fewer products (MarketScale). Being absent from the answer means being absent from the shortlist. G2 sells marketing products to software vendors and the data is self-reported, so read the percentages as directional.
How to measure it:
- Build a prompt set of 20-50 questions that mirror how buyers actually open: category comparisons (“best [category] software for [segment]”), competitor-based prompts, and use-case questions. G2 found about a third of buyers open with category comparisons and nearly a third with competitor-named prompts (G2).
- Run the set across ChatGPT, Perplexity, Gemini, and Claude on a fixed schedule. Record whether you’re mentioned, where, and which sources are cited.
- Calculate share of model: your mentions as a share of all brand mentions across the prompt set, compared with three to five named competitors. Answers vary run to run, so track the trend over repeated runs, not a single result.
- Track AI referral traffic in GA4, and treat it as a floor. Much AI-referred traffic arrives without referrer data and lands in Direct.
What to Report, by Company Stage
| Stage | Lead with | Why |
|---|---|---|
| Early (pre-scale) | Non-branded impressions and query count by intent tier; organic demo requests | Revenue lags too far behind to judge, so use leading indicators |
| Growth | Organic-sourced pipeline; MQL-to-SQL rate by landing page type | Enough volume to see which pages create sales-ready leads |
| Scale | Influenced pipeline, SEO payback period, share of model against competitors | Brand and AI visibility start to compound |
Timing: new domains typically need four to six months before SEO produces its first sales, and a B2B software sale then adds a sales cycle on top. Judge leading indicators at two to four months and pipeline well after that. Judging at month three is the most common way to abandon a program that was about to work.
Common Measurement Mistakes
- Blending branded and non-branded traffic into a single organic number.
- Counting all organic leads equally, regardless of the intent of the query that produced them.
- Reporting rankings for informational keywords as if they were commercial wins.
- Reading AI referral traffic as the whole AI channel, when most AI-influenced demand arrives untagged.
- Crediting only the last click, which hands the win to branded search and direct visits.
FAQ
What is the best KPI for SaaS SEO? Organic-sourced pipeline, supported by non-branded visibility by intent tier. Traffic and rankings are leading indicators; pipeline and revenue are the outcomes.
How long does it take to see SEO ROI for a SaaS company? Plan on four to six months for first results on a new domain, plus the length of your sales cycle before revenue shows up. Sales cycles of around 84 days are typical, and enterprise cycles run longer.
How do you separate branded and non-branded traffic in Search Console? Add a Query filter set to “Doesn’t match regex” containing your brand name, product names, and common misspellings, then compare it with the unfiltered view.
Can you attribute pipeline to SEO? Partially. Click-based attribution undercounts SEO because early research is often invisible to analytics. Combine first-touch data in your CRM, a self-reported “How did you hear about us?” field, and trends in branded search and direct traffic, and read them together instead of relying on any one.