
How to Actually Measure SEO Success (It’s Not the Same KPI for Every Business)
Ask ten SEOs how to measure success and you’ll get the same three answers: rankings, traffic, revenue. All three are real signals. None of them is the right primary KPI for every business — and treating them as interchangeable is why so much SEO reporting feels disconnected from what a business actually cares about. The right measurement approach depends on what kind of business you’re running, and in several real cases, the honest answer is that SEO’s contribution can’t be fully isolated — it can only be triangulated from several imperfect signals pointing the same direction.
Why the Default Three Metrics Break Down Alone
Rankings tell you visibility, not value. Ranking #1 for a term nobody clicks, or a term with no commercial intent, is a vanity win.
Traffic tells you volume, not fit. A traffic spike from an irrelevant viral post looks identical to a traffic spike from qualified buyers, until you check conversion behavior underneath it.
Revenue tells you outcome, but rarely tells you how much of that outcome SEO actually caused — most purchase journeys touch multiple channels before converting, and last-click reporting (still the default in most dashboards) systematically undercounts SEO’s real contribution whenever a user finds you organically, leaves, and returns later through a bookmark or a direct URL type-in (Wildcat Digital).
None of these are wrong. They’re incomplete on their own — which is why the real question isn’t “which metric is correct” but “which metric matches this specific business’s buying pattern.”
The Real Variable: How Your Business Actually Gets Bought
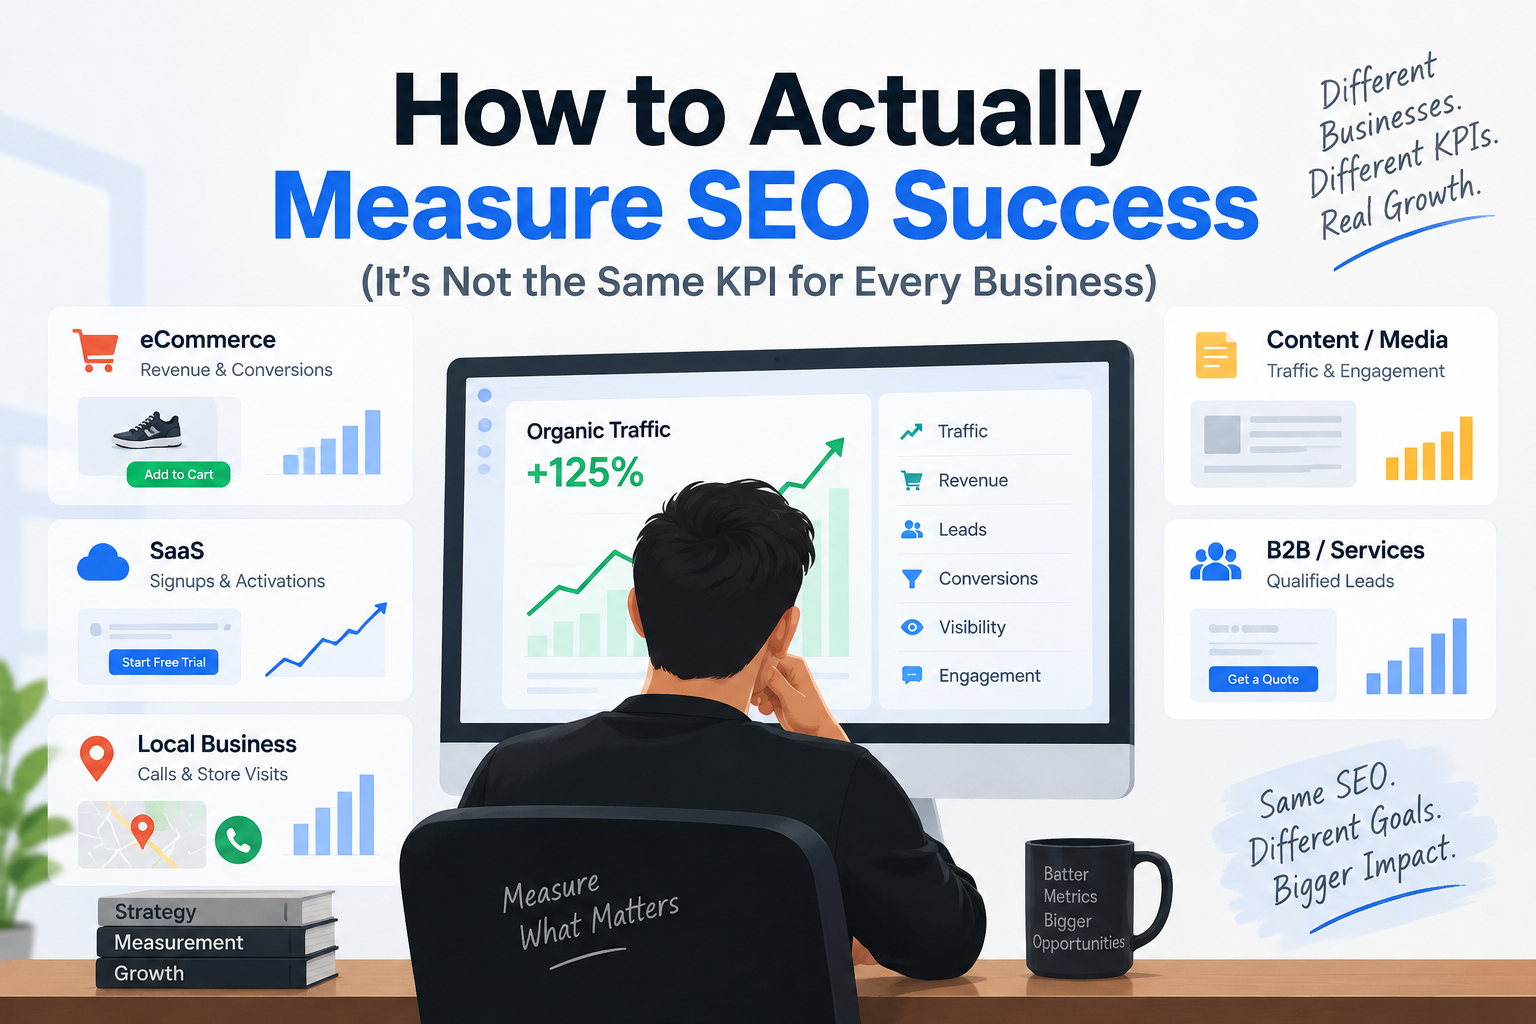
High-consideration B2B / industrial brands — the KPI is Share of Voice, not clicks. Take a brand like Schneider Electric. If it appears for 100 core category terms, the win isn’t the click-through — it’s that repeated exposure during a long, multi-stakeholder research process builds the trust that gets it into the vendor shortlist later, often through a channel with zero attribution back to search at all. This is a documented pattern in B2B measurement: in complex buying journeys, “brands that dominate visibility often become the brands buyers think of first,” and that relationship holds even though it isn’t perfectly linear or directly click-attributable (Search Engine Land). For this category of business, tracking keyword-by-keyword rank is close to irrelevant; tracking share of category visibility against named competitors is the actual KPI.
Ecommerce — the KPI is traffic volume from any entry point. A large catalog with broad conversion surface area doesn’t need one keyword to perform — it needs volume, whether that volume arrives through a blog post, a long-tail product query, or a branded search. Optimizing for any single keyword’s position is the wrong unit of analysis here; the aggregate top-of-funnel volume, segmented by whether it converts at a reasonable rate, is what actually matters.
SaaS / B2B lead-gen — the KPI is intent-segmented, pipeline-connected traffic. Raw traffic is actively misleading in this category. The standard practice is to separate branded from non-branded visibility from the start, because branded growth can mask a weak non-branded program that isn’t actually generating new pipeline (Diakachimba). Rankings should be tracked by intent group — informational, problem-aware, commercial, vendor-selection — not as one undifferentiated list, since a #1 ranking on an informational query and a #1 ranking on a vendor-comparison query represent completely different business value.
Local service businesses — the KPI is close to direct revenue. Calls, direction requests, and local pack visibility are about as close to unambiguous attribution as SEO measurement gets, because the buying journey is short and the conversion action is immediate.
Content/media publishers — the KPI is traffic plus loyalty signals. Since the revenue model is attention-based rather than transactional, raw pageviews matter, but so do daily/returning users and branded search growth — both are proxies for whether the audience is coming back because they trust the publication, not just landing once from a single ranking.
The Emerging Layer: AI Search Visibility and Citation Share
Every category above now has a parallel metric worth tracking alongside its traditional KPI: whether the brand gets cited, referenced, or recommended inside AI-generated answers for category-relevant queries — not just ranked in traditional blue links. This is a genuinely new form of the same B2B visibility logic described above; it just runs through a different surface (Search Engine Land). One caution worth stating plainly: AI and LLM visibility is a real discovery signal, but it isn’t a revenue KPI on its own unless it can be connected to actual qualified demand or sales conversations — treating citation count alone as a win is the same mistake as treating keyword rank alone as a win (Diakachimba).
The Hard Cases: Real Signals Beyond the Big Three
Rankings, traffic, and revenue don’t capture everything SEO actually does — a lot of its value shows up sideways, in signals that get asserted casually (“our direct traffic went up, must be SEO”) instead of tested properly. Here are four real signals worth tracking, each with an actual method for building the case rather than just eyeballing a chart.
Signal 1: Direct Traffic Growth
The hypothesis — “search introduced someone to us, and they now return by typing the URL or using a bookmark instead of searching again” — is plausible, but on its own a rising direct-traffic number is not evidence. Here’s how to actually test it:
Rule out attribution artifacts first. A rise in direct traffic is frequently just broken tracking: missing UTM parameters on other campaigns, HTTPS-to-HTTP referrer stripping, or app-to-web opens all get bucketed as “direct” in most default reporting setups. Audit these before treating the number as meaningful.
Compare GA4’s two attribution reports against each other. GA4 runs two different models simultaneously: User Acquisition credits whichever channel first brought a user in (first-touch), while Traffic Acquisition credits whichever channel brought them in for that specific session (last-touch) (Analytify). If Organic Search is rising in User Acquisition while Direct is rising in Traffic Acquisition, that’s the actual signature of “search introduced them, they now return without searching” — not two coincidental, unrelated trends.
Run the cohort join for real precision. Via GA4’s BigQuery export, join user_pseudo_id records to isolate users whose first touch was Organic Search, then track what channel their later sessions come through. A rising direct-return rate specifically within that organic-acquired cohort is stronger evidence than an aggregate shift in overall traffic mix, since it isolates the exact group the hypothesis is about.
Triangulate with one source outside your own analytics. Google Trends brand-query volume, or a “how did you hear about us” field on a signup/checkout flow, closes part of the gap that digital attribution alone can’t.
Signal 2: Assisted Conversions — What Last-Click Reporting Hides
Most default dashboards still report last-click, which means a channel that started the journey gets zero credit if a different channel happens to land the final click. In a typical B2B path — organic search introduces the prospect, a LinkedIn retarget brings them back, a webinar builds trust, and a direct visit finally converts — last-click attribution gives 100% of the credit to that final direct visit and makes organic search look worthless, even though it opened the entire relationship (Saber).
How to check it: in GA4, build a Multi-Channel Funnels or conversion-path comparison between “Converters” and “Multi-session converters,” and look at which channels show up frequently early in the path but rarely as the last click (DEV Community). Organic and content marketing routinely fall into this category — they start relationships they never get credited for closing. If organic search shows a high assist rate relative to its last-click conversion count, that’s real, measurable evidence that its true value is being undercounted by whatever dashboard your business currently trusts.
What good looks like: content-driven channels (blog, organic search, YouTube) typically show 70–90% assisted-conversion rates industry-wide — meaning they show up in the path far more often than they close it, and that’s expected, not a failure (NUMEN Technology). Separately, SEO audits commonly find organic search assisting anywhere from 30% to 70% of conversions that ultimately get credited to another channel (Chapters). If your organic assist rate is near zero, that’s the actual red flag — not a high one.
Signal 3: Query Count Growth — The Leading Indicator Nobody Checks
Search Console’s default view shows clicks, impressions, and position — but not how many distinct queries your site shows up for, which is a genuinely different and often earlier signal. A site’s query count can quadruple while clicks stay flat, because new topical coverage is being indexed and matched to searches before it’s had time to earn top rankings (SEO Gets). Read this pattern correctly and it tells you the opposite of what the flat traffic number suggests: the SEO work is compounding, it just hasn’t converted to clicks yet.
How to check it: export your Search Console query list monthly and count distinct queries (not just top queries), segmented by branded vs. non-branded. Rising query count with flat clicks is a foundation-building signal; rising query count with rising clicks is the “growth is compounding” scenario worth flagging to stakeholders explicitly, since it’s easy to miss inside a standard clicks-over-time chart.
What good looks like: there’s no universal industry-wide target here — be wary of anyone quoting one — but one documented case tracked a site’s query count quadrupling over roughly three to four months of consistent publishing, while clicks stayed flat and impressions even dipped slightly due to seasonality (SEO Gets). Read correctly, that’s a site building topical foundation, not a stalled one. Separately, in topical-authority-focused B2B SaaS programs, a 25–40% lift in non-branded cluster clicks (as a share of total non-branded clicks) alongside a 10–15% AI citation share is a commonly cited target window at the 12–16 week mark of consistent weekly publishing (SEOJuice) — useful as a directional benchmark, though treat it as one program’s reported range rather than a guaranteed timeline for any site.
Signal 4: Branded Search Growth — Tracked as Its Own Line, Not a Footnote
Branded query growth (people searching your company or product name directly) is a real, independent brand-awareness signal — but only if tracked separately from total organic performance, since blended reporting lets branded growth quietly mask a stagnant non-branded program (Diakachimba).
How to check it: segment Search Console queries into branded vs. non-branded buckets and track each trendline independently. If branded impressions are climbing while non-branded impressions are flat, your SEO is building recognition among people who already know you, not necessarily reaching new audiences — a distinction worth reporting honestly rather than blending into one “organic is up” headline number.
None of these four signals prove SEO caused a specific outcome by itself. What they do, together, is build a case — and a business willing to report “here’s what the evidence supports, and here’s what it doesn’t yet show” is doing SEO measurement more honestly than one reporting a single confident number.
This is the honest version of SEO measurement: not “SEO caused X,” but “here’s a hypothesis, here’s the checkable evidence for and against it, here’s how confident that evidence lets us be.”
The Takeaway
There’s no universal SEO scorecard. Rankings, traffic, and revenue are all legitimate — for the right business, at the right stage, matched to how that business actually gets bought. The businesses that measure SEO well aren’t the ones with the fanciest dashboard; they’re the ones who’ve correctly identified which single metric matters most for their model, track it honestly, and treat everything else — direct traffic shifts, branded search growth, AI citation share — as supporting evidence in a case they’re building, not a number they’re allowed to claim outright.